
I’ve worked with Clayton Christensen, co-founder of the Christensen Institute and architect of Disruptive Innovation, for many years, and discussed everything from business strategy to the elliptical orbits of planets around the sun. Over the last few years one idea has come up time and time again: data are not discovered but created. And I see this struggle in how some people feel about Microsoft Excel.
The computing program is an excellent tool and has undeniable utility, though a cursory Google search reveals hundreds of memes that express people’s frustrations with some of absurdities of the tool. More important than this, though, Excel embodies two serious problems about data. To Christensen’s point, the measurements and decisions we make determine what goes into our spreadsheets, before any calculations are even made. The second problem is that the rows and columns of figures in an Excel spreadsheet sometimes obscure causality.
We create data
Every executive who has sat in a board room has witnessed how data can cause rather than solve problems. Typically, when a firm faces an important decision or a serious threat, different departments come armed with their data in support of their preferred course of action. They can do this because they’ve created data in support a of decision they’ve already made. They’re not simply acting cynically; each group truly believes that they know the right answer. They build their data to help them show others the light. But as the renowned economist Ronald Coase said in 1981, “If you torture the data enough, nature will always confess.”
In academic research, scholars typically try to bypass the problem of their own bias by using “sharper knives”—essentially more sophisticated tools than Excel. But a sharper knife doesn’t eliminate the fundamental problem faced by researchers. Day in and day out, researchers cannot avoid the struggle of turning complex real-world events into numbers that they hope will enable them to find the truth.
In fact, as big data has become more prevalent, decisions about how and what to measure often wreak havoc. As an example, data science struggles with what’s called “the data fusion problem.” Researchers would love to have at their disposal a big, neat and tidy data set formed from a group of related studies. Instead, they’re confronted with the often impossible task of creating coherence among heterogeneous sources of data, each of which has been measured, collected, or recorded differently. Try as they might, they can’t escape the reality that data doesn’t exist on its own, waiting to be discovered.
Causality is hidden
The essence of causation is regular change from one state to another. But as the spreadsheet from a recent blog of mine about baseball shows, causality isn’t always obvious. In the spreadsheet below some data have been entered manually and some have been generated by formulas using other data on the same sheet. The “hidden” formulae that turn one column into another are actually causal mechanisms—they predictably turn one thing into another.
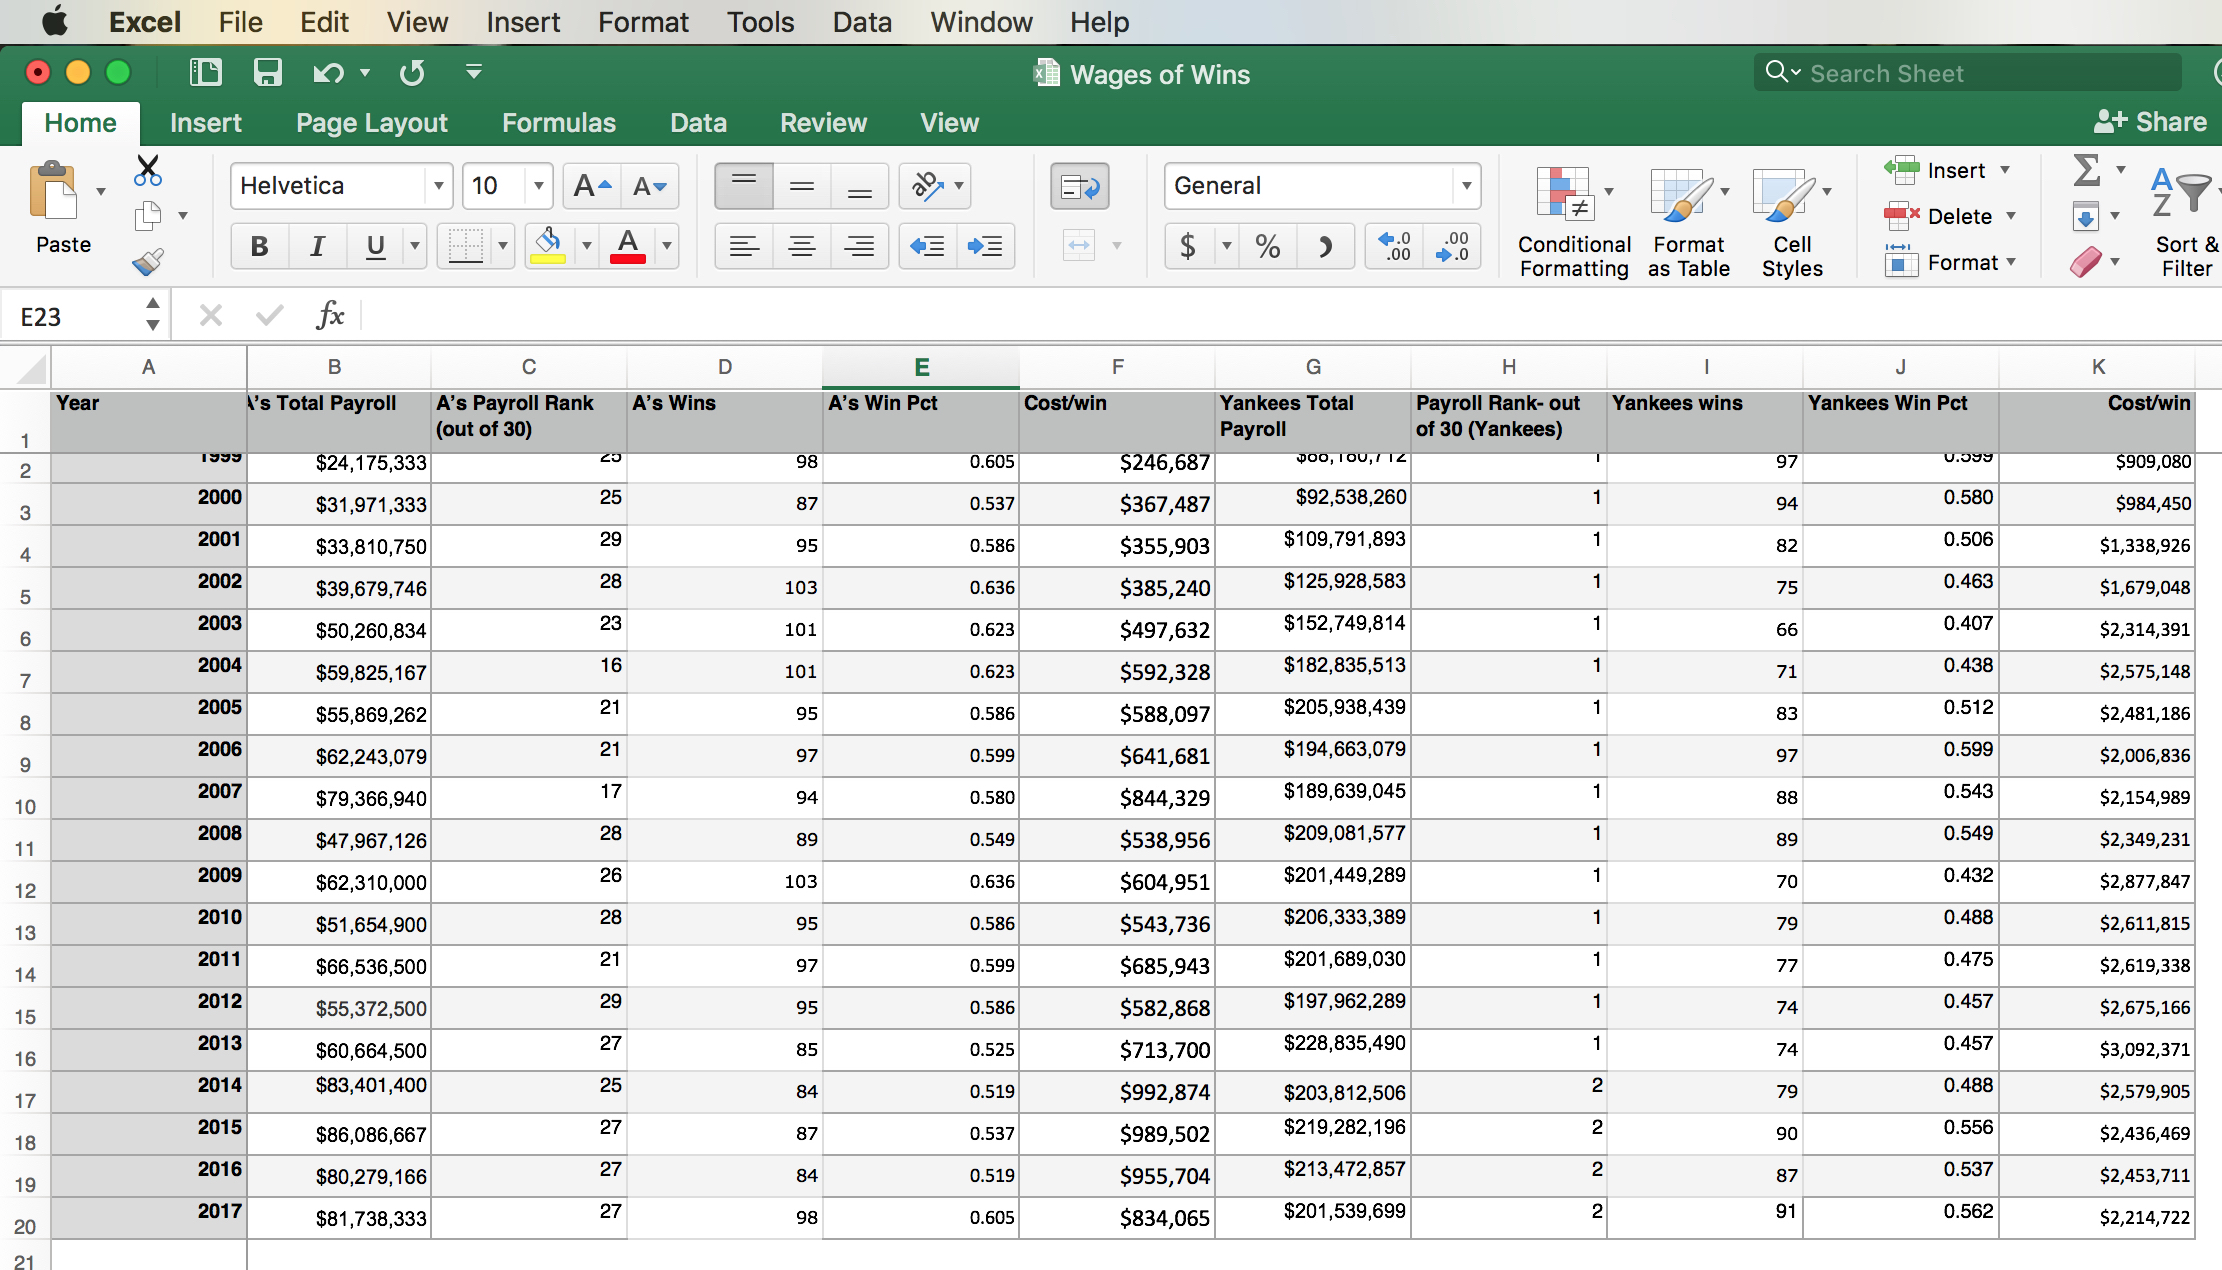
The problem with this spreadsheet and others like it is not just that people unfamiliar with the software don’t know how to find the formulae, but that there are myriad events that underlie the data. In this example, data shows information about payroll and winning percentages in Major League Baseball. Yet outside of this data set, there are literally thousands of small things that influence both of those things: aggressiveness of an agent, injury, a player’s desire to stay with his team or go, how good a team’s pitching is, whether batters will swing at pitches they can’t hit, the league’s minimum salary, the peculiarities of the field each team plays on, etc.
Put another way, while Excel and other tools may enable us to see the formulae—the human-made causal mechanisms in the data—it still cannot reveal to us all relevant causal factors like ball field layout and player motivation.
The world is not made of numbers, or as Christensen likes to say, “Data don’t descend on us as a gift from heaven.” For this reason, we’ll never be free from the need to make consequential decisions about what to measure and what to record. What’s more, even if we have very good tools and training, causes are in most cases literally hidden. That’s why we need to be humble as we create our own or use others’ data. Our decisions about data can easily lead us to confusion rather than clarity about what we really seek: a model or explanation of the causal relationship that binds cause to effect.